
4.3.1.1 Time Plot Mode
- Roll Mode: In this mode, the plotted waveform scrolls from right to left on the screen.
- Scope Mode: In this mode, the waveform is redrawn periodically or when a trigger condition is encountered.
These modes are selected using the two leftmost buttons on the timeplot toolbar:
Configuring Triggers
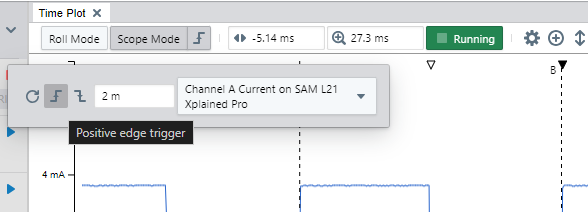
The trigger function of the Scope Mode is configured by clicking the Trigger Settings button to the right of the Scope Mode button. The icon on this button shows the active trigger mode at any time.
- Trigger mode:
- No trigger (periodical updates)
- Positive edge trigger
- Negative edge trigger
- Trigger threshold: Data value threshold.
- Trigger source: The data source to monitor.
When No Trigger is selected, the time plot is not updating on a trigger condition. Instead it is repeatedly updating at a rate that corresponds to the current Time Scale of the time plot. For example, if the time scale is 0.1 second, the update rate will be around 0.1 seconds. This is a relatively easy setting to start with.
When Positive or Negative Edge Trigger is selected, the Data Visualizer will start an update cycle with capturing enough data to fill the area to the left of the trigger point. It will then start looking for the trigger condition. When the trigger condition is detected, the Data Visualizer will continue to capture enough data to fill the area to the right of the trigger point, and after this the plot is updated.
If the Time Scale is larger than 1 second, the part of the plot that is after the trigger point will be plotted live as data is being captured. Combined with setting the Time Reference to the left side, this is similar to an EKG plot.
If the time plot does not update as expected when a trigger condition has been configured, check the configured trigger settings first. Switch to the simpler Roll Mode temporarily to check that data is being captured and plotted in this mode. Also, check that the plot is in Run Mode, that the plots have been configured properly, and that the plotted data sources and the trigger source are capturing data.