
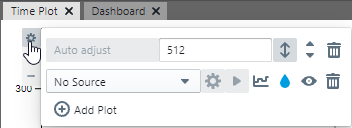
4.3.1.4 Add Data Axes
To add another data axis,click on the Add Data Axis icon  on the
time plot toolbar.
on the
time plot toolbar.
Data axis controls are displayed in the right side panel. Alternatively, select the axis and click on Axis Options. On the axis controls is another selection to add a data axis. Both methods provide a control to add a plot to the axis.
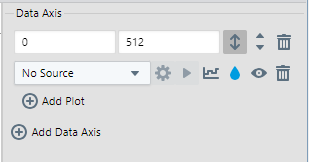
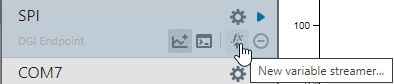
In addition, once the axis is set up, data can be plotted from the Data Sources pane by clicking the plot button on the selected data source.
If several data axes are present, their vertical ordering can be adjusted with the arrow buttons on the Axis Options. The data axes can also be moved by hovering on an axis and using the ellipsis handle to drag the axis and drop it on the desired plot area. An axis dropped on the upper or lower part of a plot area will be placed on a new plot above or below the current one.