
4.3.1.3 Panning and Zooming
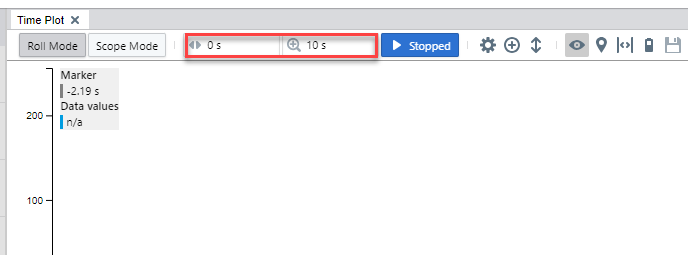
In the time plot, Time Offset refers to the amount that the plot has been panned to the left or right. Time Scale refers to the zoom level, or the time spanned by the visible time axis.
Two numeric inputs in the time plot toolbar control the time offset and time scale. The inputs accept numbers with a metric suffix such as “5 ms”. When edited, the new value will apply after pressing enter or clicking somewhere else with the mouse.
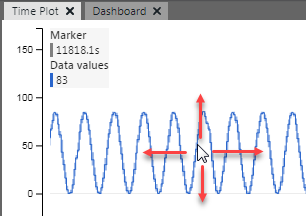
- Click on the data axis on the left side of the plot to pan the plot vertically.
- Click on the plot area or on the time axis to pan the time axis.
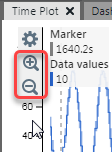
To manually zoom in the plot, use these controls:
- Use the mouse wheel to zoom in and out on the axis. The plot will resize accordingly.
- Use the mouse wheel to zoom in and out in the graph area.
- Click on an axis to see options to zoom in and out.
Above the plot area are two triangular markers labeled as trigger point and reference point. When the time offset is 0, the two markers are rendered on top of each other. When the time plot is panned manually to either side, the trigger point will move with the waveform while the reference point stays put. The position of the reference point can be configured in the Time Plot Options dialog. In run mode, zoom operations are around the reference point.