
4.3.1.10 Other Time Plot Settings
Click the cog button on the time plot toolbar to display the time plot settings dialog.
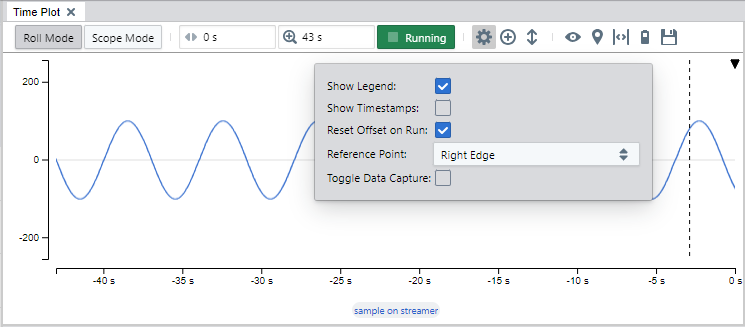
The settings dialog include the following settings:
- Show legend: When enabled, labels with the plotted signal names are displayed under the plot.
- Show timestamps: When enabled, the time axis and inspect values boxes will display sample timestamps instead of offset from the trigger point.
- Reset offset on run: When enabled, the time offset will be set back to 0 when entering Run Mode (this is the default).
- Reference point: Selects the position of the reference point within the plot area. Time Offset is relative to this point.
-
Note: The reference point is always reset to the default location when changing the Time Mode:
- In Roll Mode, the default setting is the right edge of the plot area (where data ‘arrives’)
- In Scope Mode, the default setting is center
- Toggle data capture: This option lets the time plot control the data source capture state. The time plot’s Running/Stopped button will not control whether the data source is capturing data or not by default. If the plot is stopped for a long time while the source is capturing data, there is a chance that the data that is being displayed is discarded in the background to save memory. By enabling this option, there is less chance that data will be discarded while the plot is stopped.