
4.3.1.5 Configure Data Axes and Plots
The axis and plot settings in the right pane control which data sources are plotted on which axes, as well as the appearance of the plots.
| Control | Description |
|---|---|
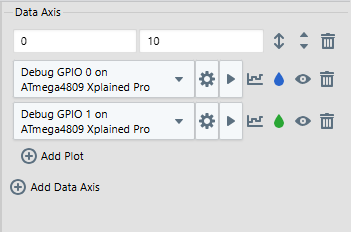
| Offset | Displays the vertical offset of the plot relative to the center of the data axis. |
| Scale | Displays the value range of the data axis. |
 | Auto adjust enable/disable. When enabled, automatically adjust range of axis. When disabled, manually adjust range of axis. |
 | If more than one data axes, move this axis up or down relative to others. |
 | Click to delete this axis from the graph. |
 | Add another data axis to the graph under current axes. |
| Control | Description |
|---|---|
| Data Source | Select the data source to plot from the drop down list. See the Data Sources pane for selection and setup. |
 | Click to select how data points are shown on the graph.
|
 | Click to select a graph color. |
 | Show/hide graph plot. |
| Click to delete this plot. |
 | Add another data source to plot on the current axis. |