Move Each Plot to an Axis
For this example, there are only two plots on one axis, but the same procedure would work for more.
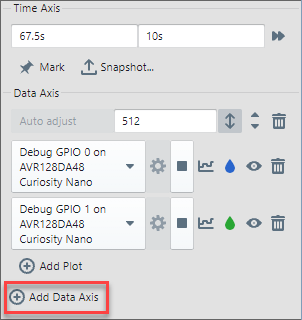
1. Add another axis to the Graph. An empty axis will appear beneath the original.
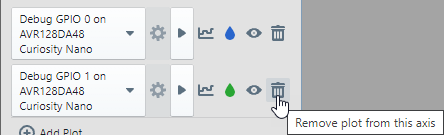
2. Delete one plot from the original axis.
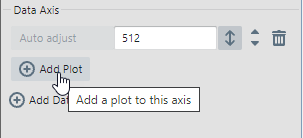
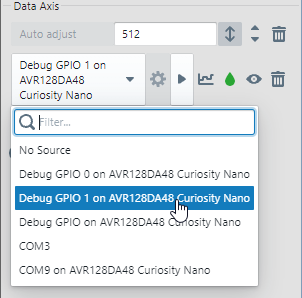
3. Add the deleted plot to the new axis. Click “Add Plot” and then select the deleted plot from the drop-down list.
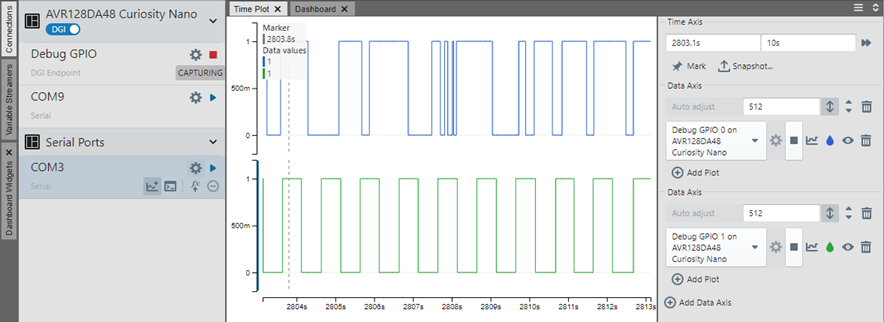
4. Each plot will be on its own axis and will be much more visible.