Analyzing Plot Data with Tools
Graph tools may be used to change the view of and analyze plot data.
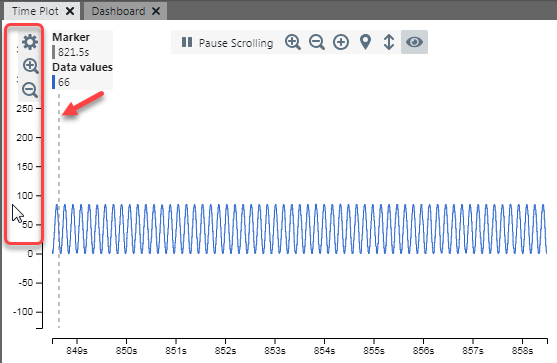
Adjusting an axis range and plot location can make viewing data easier. In the image below, the Data Value (vertical) axis is circled for example. Click on or near the axis you want to adjust. Then use the mouse wheel to zoom in or out on the axis range. You can also click and hold to drag the axis one way or the other, thus moving the plot accordingly. There are also controls at one end of the axis that can be used to zoom in or out and set plot characteristics as on the Visualization pane.
On the graph there is a rolling vertical marker that will follow mouse movements and show the corresponding Time (horizontal axis) and Data Value (vertical axis).
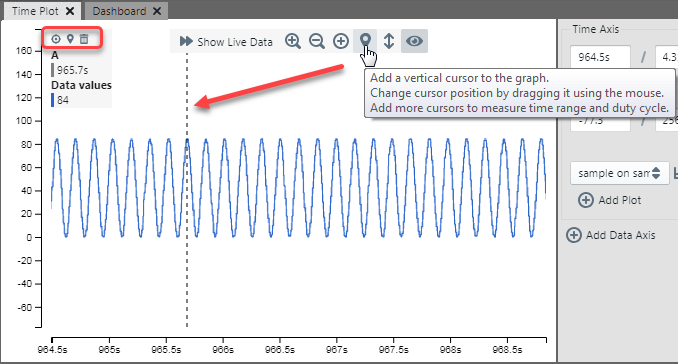
To enable a vertical cursor that may be dragged and dropped at a plot location, click as shown below to enable cursor A. This will disable the rolling marker.
Controls for the cursor will appear where the rolling marker information had been located.
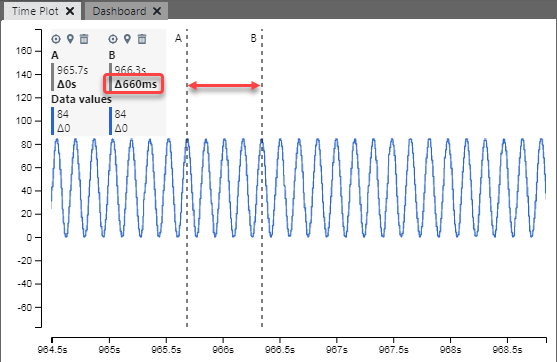
To determine time between plot points, enable another vertical cursor, set its location, and then view the time delta.