View Data based on Plot Setup
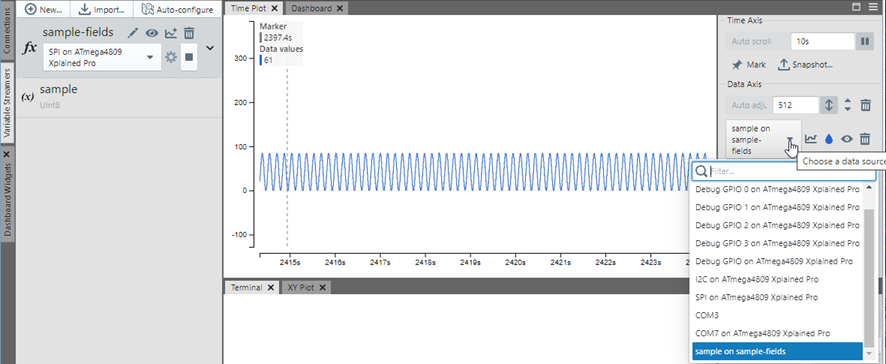
The Time Axis Source should now be set to “sample on sample-fields” and data should be plotted on the graph. In order to toggle the data scrolling in the graph, press "Pause Scrolling/Show Live Data" on the Graph banner, or use the Space key.
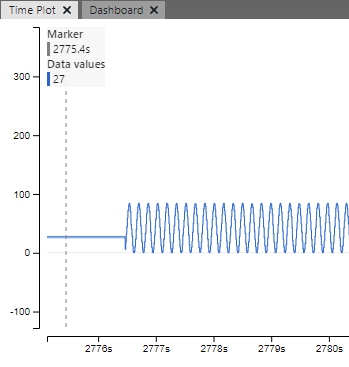
When debug is paused  , data output is stopped.
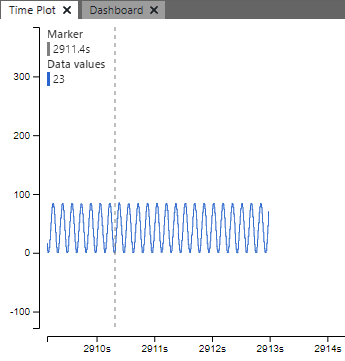
When debug is continued,  , data is
again shown on the graph.
, data is
again shown on the graph.