Plot Streaming Data for SPI
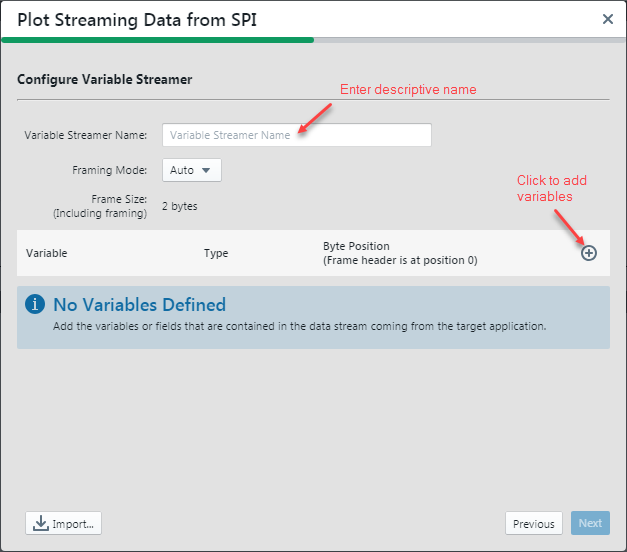
Configure Variable Streamer - Initial View
For this example, the values of a variable will be streamed and plotted. The first dialog of the plotting wizard will look as below. Name the variable streamer to identify the setup later. Then add the variable by clicking on the “+” as shown to display text boxes for entry.
Also, using the “?” key opens a keyboard shortcuts dialog, and using the “Esc” key closes the dialog.
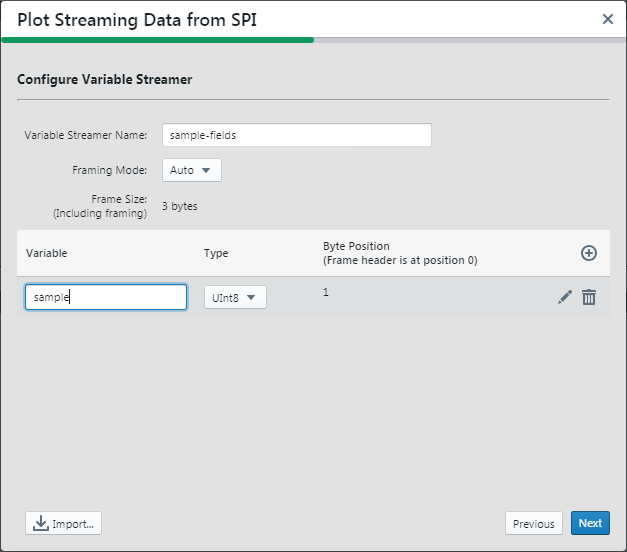
Configure Variable Streamer - Enter Data
The dialog below shows the previous dialog with data entered. Specified information on the variable has been provided.
In order to decode a data stream, the variables (or fields in the data stream) must be defined. The data streamed will be of the format shown in Stream Format.
Click Next to proceed with setup.
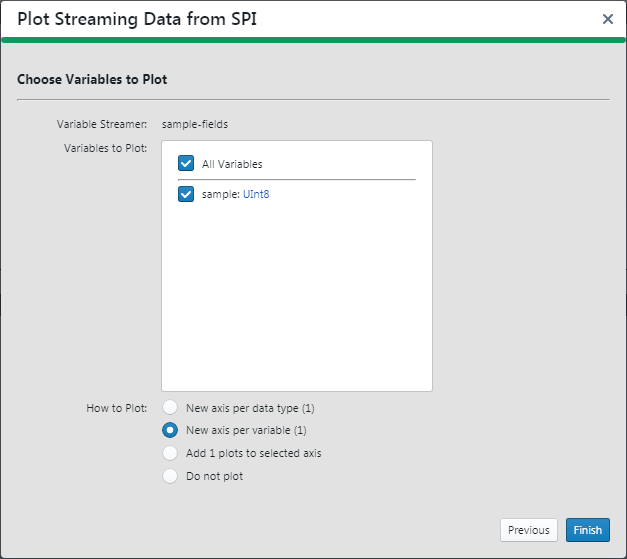
Configure Variable Streamer - How to Plot
This dialog shows a summary of the previous one and a selection list of how to plot the data. For this example, “New axis per variable (1)” has been selected.
Click Finish to proceed to plot.