
20.3.11 Analyzing Results
The Analysis tab displays the estimated power consumption of individual blocks, gates, nets, I/Os, and memory and enables you to make a hierarchical analysis of your power consumption. The Analysis tab may also help you to improve your power consumption by identifying the components that consume a significant amount of power.
To identify the components consuming the most power:
- Use the Analysis tab to expand the design hierarchy. The Analysis tab enables you to expand your design hierarchy and view a complete list of the blocks in your design. In the hierarchy window, click the + next to your design to view the items in the hierarchy. Click the + next to a sub-block to view its sub-elements.
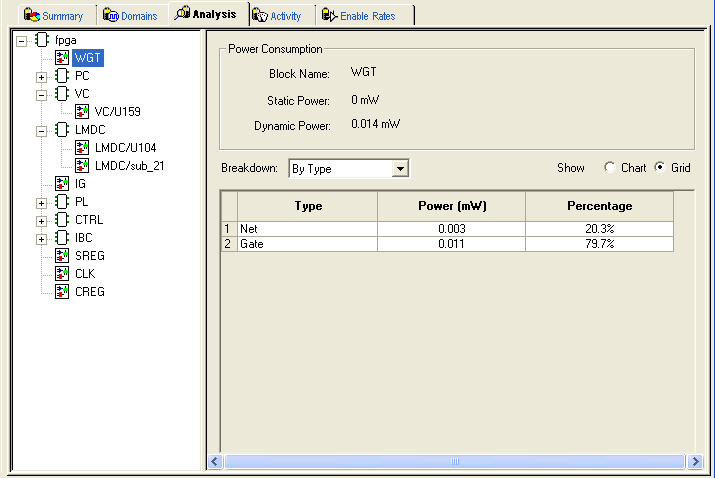
- Click to select a block. By default, SmartPower selects the design-level block, but you can always select another block in the hierarchical tree. The Report window displays the list of sub-elements of the selected block.
Initially, this list includes all sub-elements. The grid in the Analysis window displays a breakdown of the power of the selected block by type. This breakdown provides you a good overview of which areas of your design you should optimize for power.
- To find the components that use a significant amount of power, select By Instance from the Breakdown drop-down list.
- Sort and filter the sub-elements to find the component that is using the most power. The Analysis window displays the list of sub-elements of the selected block. By default, this list includes all sub-elements. The grid contains columns for name, type, power, driver, fanout, macro, I/O standard, output load, output drive, slew, port, domain and frequency. You may limit the list of sub-elements to a list of sub-blocks, nets, gates, I/Os, memories, or any combination of these five classes of sub-elements. You can sort the list according to any column by double-clicking the column header.