3.5.1.24.2 Call Graph
(Ask a Question)When you open the Scheduler Viewer, the default view is of the Call Graph. You can also click on the “Call Graph” tab at the top. The Call Graph shows the top-level function and all of the sub-functions that are called.
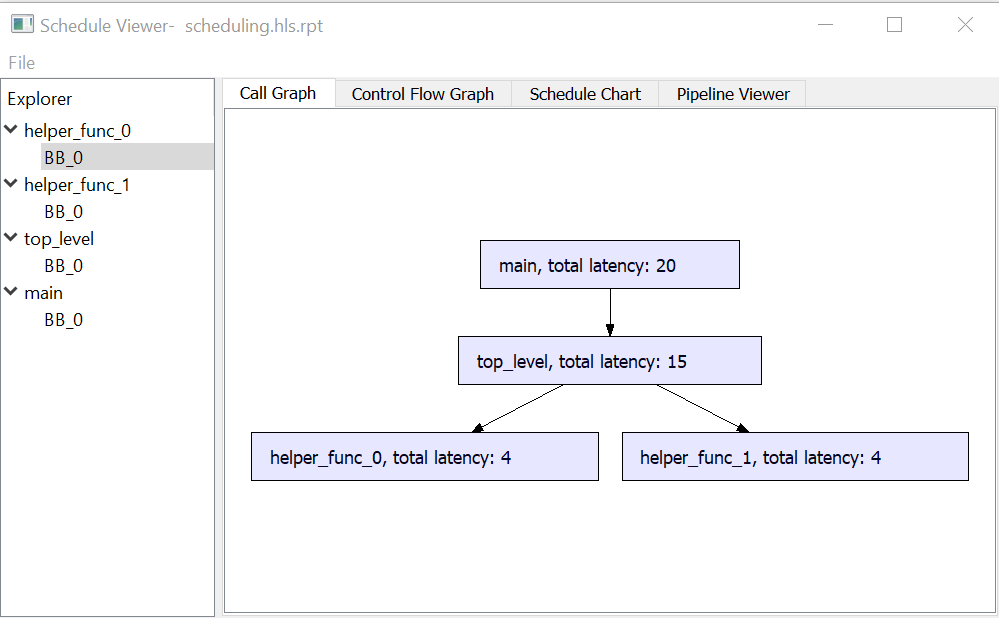
For example the following code has a function main which calls top_level which in turn calls helper_func_0 and helper_func_1. The noinline attributes makes sure that SmartHLS™ does not in-line these small functions into the main function body, making sure we can see them in the Call Graph.
__attribute__((noinline))
void helper_func_0(int a) {
    gv += a;
}

__attribute__((noinline))
void helper_func_1(int a) {
    gv -= a;
}

__attribute__((noinline))
void top_level() {
    helper_func_0(10);
    helper_func_1(5);
}

int main() {
    top_level();
    return 0;
}
This will generate the Call Graph shown below. The Call Graph shows that main calls top_level, which in turn calls helper_func_0 and helper_function_1.