3.5.1.8.2 Modes
(Ask a Question)SmartHLS™ supports two debugging modes, the debugging mode and the monitoring mode. These two modes are mutually exclusive, and users can toggle between both modes by changing the monitoring_mode variable in update_vcd.tcl to 1 for monitoring mode and to 0 for debugging mode.
Debugging Mode
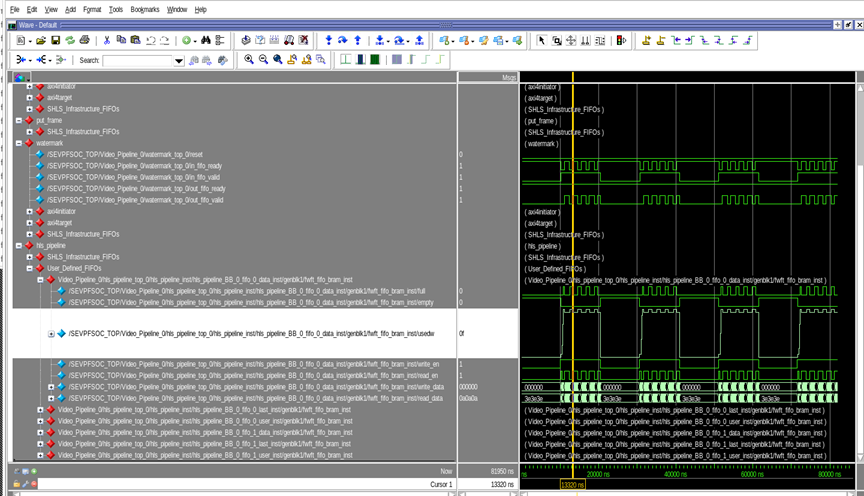
This mode is for interactive on-chip debugging, which is the most common and typical way to interact with on-chip instrumentation. In this mode, users are responsible for running the debugger, setting, and arming triggers in the Identify_debugger tool. For example, a trigger condition could be set when an AXI valid signal is asserted high. Once the trigger happens, Identify_debugger will generate .vcd file(s) and SmartHLS users can source the update_vcd.tcl script in ModelSim to refresh the newly captured samples. To make the refreshing process simpler, we have added a ModelSim keyboard shortcut, vsim_keyboard_shortcut that refreshes the waveform when Ctrl+R is pressed. SmartHLS also generates the wave_template.do file that can be used by ModelSim and it includes the selected signals grouped by top-level module.
The following image shows the signals of an example design organized based on the waveform template generated by SmartHLS.

Monitoring Mode
This mode is for long-term monitoring of the design. This mode will continuously trigger all the IICEs in the FPGA design. When sourcing the update_vcd.tcl script in this mode, ModelSim will refresh with the newly captured samples automatically as soon as there are new .vcd files produced by Identify_debugger tool.
identify_debugger_shell -licensetype identdebugger_actel
                          hls_output/scripts/instrument/monitor.tcl [YOUR PROGRAMMER_ID HERE, OR *
                          TO LET IDENTIFY DECIDE]
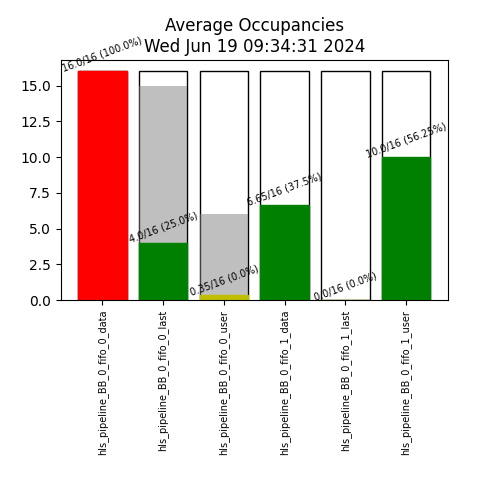
This mode is especially helpful for monitoring the occupancy levels of FIFOs.
shls instrument_monitor_fifos will generate a plot (see the following image) showing the average occupancy over the last sample dump of each FIFO in your HLS design.
shls soc_accel_proj_program as a dependency. If you are not programming using your board using shls soc_accel_proj_program, run shls -s instrument_monitor_fifos to skip all dependencies. By default, this command assumes that the project's synthesis directory is under hls_output/soc/synthesis, which is true if the project uses the SoC Flow. If your synthesis directory is elsewhere, you must run:shls instrument_monitor_fifos INSTRUMENT_SYNTH_PATH=[YOUR PATH TO THE
SYNTHESIS DIRECTORY HERE]The dashboard generation Python scripts are in lib/python/instrumentation. You can use these scripts to create your own dashboards, or run the existing scripts in Jupyter notebooks.
For detailed examples, refer to the following link: https://github.com/MicrochipTech/fpga-hls-examples/tree/main/auto-instrument.
