
7.13 Viewing the Design Memory Map
(Ask a Question)The View Memory Map toggle window displays the memory map corresponding to various initiators in the SmartDesign component and displays each initiator to target(s) connectivity path in a tree format. To open the window, click View Memory Map icon in the SmartDesign toolbar. The dockable View Memory Map window appears to the right side of the canvas.
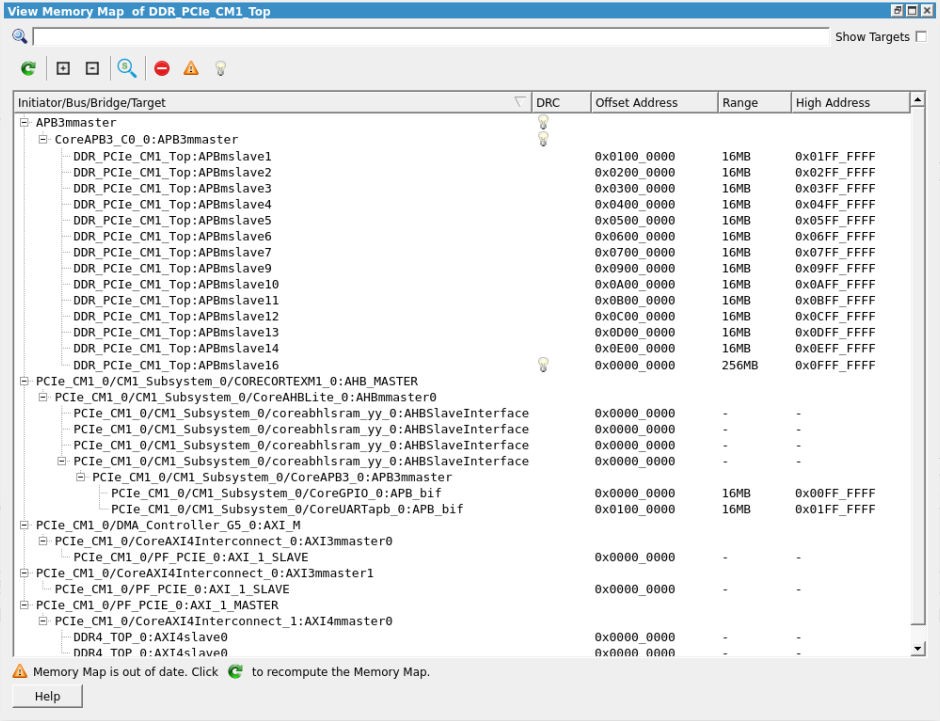
This window shows the memory map starting from an initiator in the design to targets connected through bus and bridge cores. There can be various types of bus and bridge cores in the path from initiators to targets.
Each target in the memory map is shown with an Offset Address, Range, High Address, and DRC. If the Memory Map DRC detects a partially invalid or invalid structure, an Error or a Warning icon with a tooltip message is shown. DRC is flagged if a target cannot be accessed completely or partially by the initiator’s address space.
DRC errors in the Memory Map corresponding to a SmartDesign component and its hierarchy are flagged when the SmartDesign component is generated and are printed as messages to the Log window. If DRC are warnings, the SmartDesign component generation passes. However, if the DRCs are errors, the SmartDesign component generation fails. There is an option to downgrade Memory Map DRC errors to warnings and let the SmartDesign component generation to go through without failing. To set these options, open the Libero SoC Project Settings SmartDesign page.


- Search: Searches for a specific initiator, bus, bridge, and target in the memory map by specifying a full or partial name in the search box.
- Show Targets: Shows all the initiator to target(s) paths without the buses and bridges that connect them with their start addresses, ranges, and DRCs if any. The initiators, bus, and bridge cores are not shown.
- Refresh: Updates the content of the Memory map. It becomes active only when something is changed on canvas.
- Expand: Expands and shows the full path of all the initiators in the memory map starting from the initiator to the targets.
- Collapse: Collapses the memory map tree and only shows the initiators in the window.
- Zoom and Center: Toggle action. If checked, the canvas zooms to the selected item after every selection.
- DRC Filters: It filters the DRC messages, if any. It categorized the message on the basis of severity: error, warning, and information.
Additional Memory Map functions allow you to sort items by their offset or high addresses and ranges.
- Click the columns of the header to sort the items in ascending or descending order.
- Click the first column of the header to see the initial view of the table.