SoC Profiler Overview
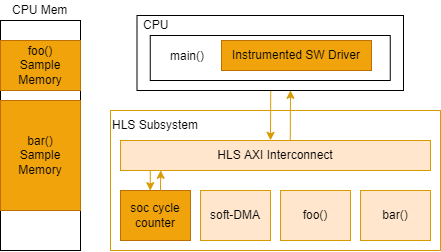
(Ask a Question)In general, when profiling an application there are overheads in the form of storage (for profiling timestamp samples) and runtime caused by timestamp acquisition. SmartHLS™ tries to minimize this by instantiating a simple 48-bit cycle counter in the FPGA fabric to read the timestamps from and store them in CPU memory. In this context a timestamp sample is the value read from the 48-bit cycle counter at a point in time. Obtaining a timestamp this way is as fast as a memory-mapped register read to the cycle counter and the timestamp samples do not use on-chip memory for storage. SmartHLS also automatically instruments the autogenerated driver API functions to read the timestamps. The figure below shows these three aspects of the profiler architecture: the storage, the instrumented software API driver and the cycle counter. In this case foo() and bar() are the functions to be profiled after being compiled to hardware modules.