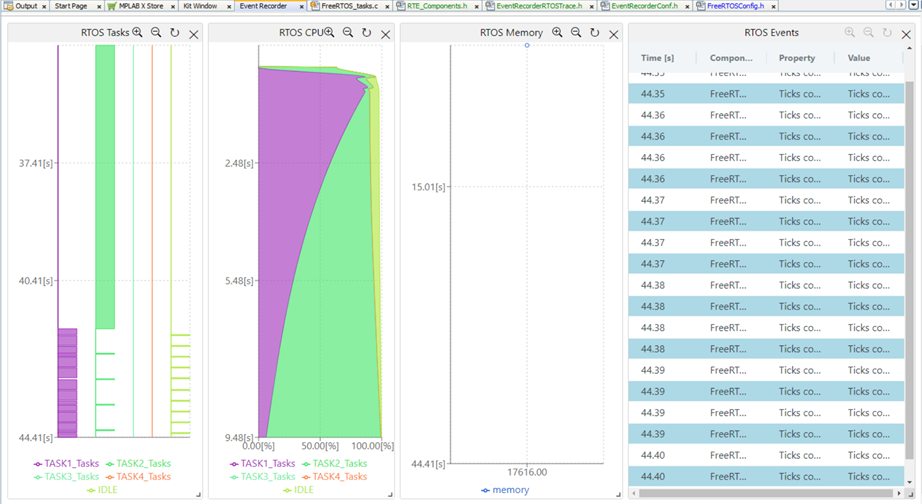
14.9.3 View Data in Event Recorder
To view data in the Event Recorder:
- Rebuild the project and launch a
debug session. Watch as the plots are updated continuously. Then
Pause or halt the debug session to stop real-time
updates.Note: You should Pause or halt the debug session before continuing.
Figure 14-14. Halt Streaming Data 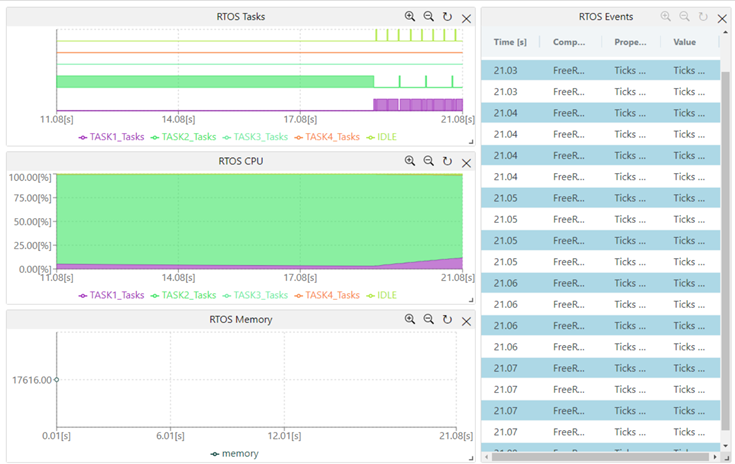
- Mouse hovering over the plot will
show more details on the plot data.
Figure 14-15. View Plot Data 
- You can move the view of the plot
(panning) by left-clicking-and-holding the mouse before moving.
Figure 14-16. Pan Left and Right 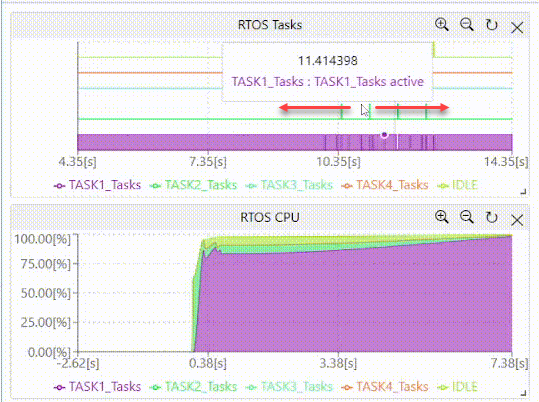
- By clicking the magnifying glass
buttons you can zoom in (+) or zoom out (-) with respect to time.
Figure 14-17. Zoom In and Out 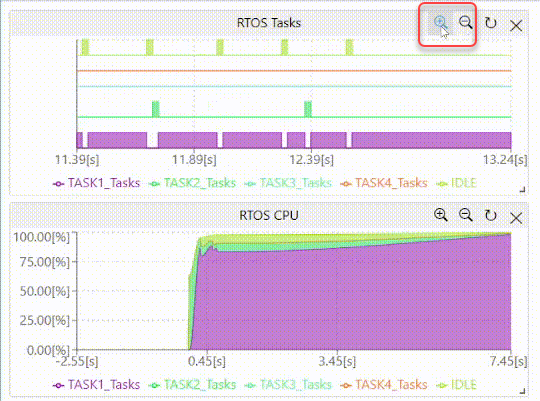
- Use your mouse wheel to scroll up and
down in the event table to see historical events.
Figure 14-18. Mouse Scroll Events 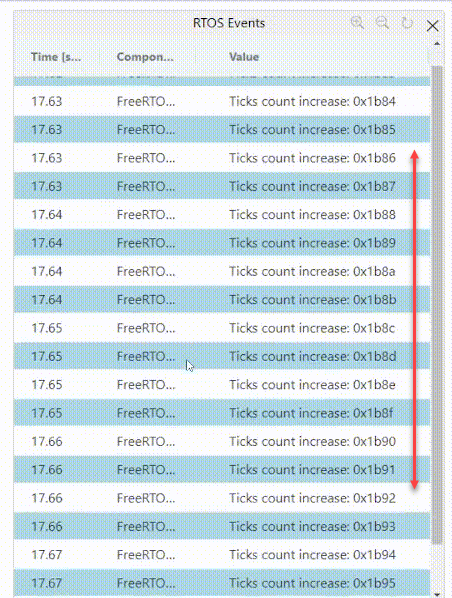
- By clicking the rotate button, you
can have a plot with vertical time axis.
Figure 14-19. Timeline on Bottom (Horizontal) 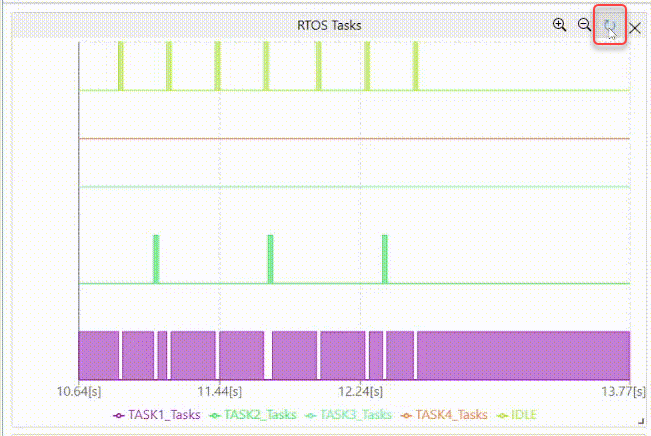
Figure 14-20. Timeline on Side (Vertical) 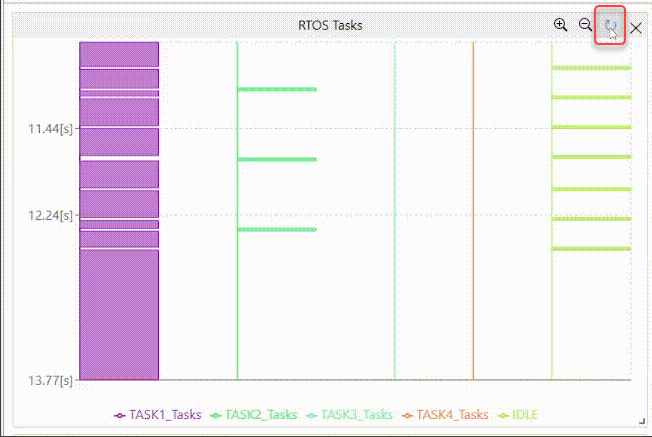
- Resize the plots, rearrange the
layout, and you can have plots with vertical time axes.
Figure 14-21. Three Plots with Vertical Time Axes 