
49.34 Bluetooth Low Energy RF Characteristics
| DC Characteristics | Standard Operating Conditions: VDD33 = VDDIO = AVDD
= 1.9–3.6V (Unless Otherwise Stated) Operating Temperature: -40°C ≤ TA ≤ +125°C for Extended Temperature | ||||||
|---|---|---|---|---|---|---|---|
| Parameter Number | Symbol | Characteristics | Min. | Typ | Max. | Units | Conditions |
| BTG1 | FREQ | Frequency Range of operation | 2402 | — | 2480 | MHz | — |
| BTTX1 | TXPWR:PA | Bluetooth Transmit Power PA | — | 11 | — | dBm | — |
| BTX2 | TXIB:1MBPS | In-band emission for FTX±2 MHz | — | -42 | — | dBm | — |
| In-band emission for FTX±(3+N) MHz | — | -48 | — | dBm | — | ||
| BTX3 | TXIB:2MBPS | In-band emission for FTX±4 MHz | — | -49 | — | dBm | — |
| In-band emission for FTX±5 MHz | — | -52 | — | dBm | — | ||
| In-band emission for FTX±(6+N) MHz | — | -55 | — | dBm | — | ||
| BTRX1 | RXSENSE | Receiver Sensitvity at 1 Mbps | — | -99 | — | dBm | — |
| Receiver Sensitvity at 2 Mbps | — | -96 | — | dBm | — | ||
| Receiver Sensitvity at S = 8 | — | -108.5 | — | dBm | — | ||
| Receiver Sensitvity at S = 2 | — | -103 | — | dBm | |||
| BTRX2 | MAXINSIG | Maximum Input signal level at 1 Mbps | — | 0 | — | dBm | — |
| Maximum Input signal level at 2 Mbps | — | 0 | — | dBm | — | ||
| Maximum Input signal level at S = 2 | — | 0 | — | dBm | — | ||
| Maximum Input signal level at S = 8 | — | 0 | — | dBm | — | ||
| BTRX3 | CI1M:COCH | C/I Co channel Rejection | — | 13 | — | dB | — |
| CI1M:±1 MHz | C/I Adjacent Channel Rejection | — | 15 | — | dB | — | |
| CI1M:±2 MHz | C/I Adjacent Channel Rejection | — | 7 | — | dB | — | |
| CI1M:ADJ(3+n) | C/I Alternate Channel Rejection | — | 6 | — | dB | — | |
| CI1M:IMG | C/I Image Frequency Rejection | — | 11 | — | dB | — | |
| CI1M:IMG±1 MHz | C/I Adjacent Channel to Image Freq Rejection | — | 12 | — | dB | — | |
| BTRX4 | CIS2:COCH | C/I Co channel Rejection | — | 11 | — | dB | — |
| CIS2:±1 MHz | C/I Adjacent Channel Rejection | — | 19 | — | dB | — | |
| CIS2:±2 MHz | C/I Adjacent Channel Rejection | — | 18 | — | dB | — | |
| CIS2:ADJ(3+n) | C/I Alternate Channel Rejection | — | 7 | — | dB | — | |
| CIS2:IMG | C/I Image Frequency Rejection | — | 18 | — | dB | — | |
| CIS2:IMG±1 MHz | C/I Adjacent Channel to Image Freq Rejection | — | 13 | — | dB | — | |
| BTRX5 | CIS8:COCH | C/I Co channel Rejection | — | 3 | — | dB | — |
| CIS8:±1 MHz | C/I Adjacent Channel Rejection | — | 20 | — | dB | — | |
| CIS8:±2 MHz | C/I Adjacent Channel Rejection | — | 14 | — | dB | — | |
| CIS8:ADJ(3+n) | C/I Alternate Channel Rejection | — | 3 | — | dB | — | |
| CIS8:IMG | C/I Image Frequency Rejection | — | 14 | — | dB | — | |
| CIS2:IMG±1 MHz | C/I Adjacent Channel to Image Freq Rejection | — | 15 | — | dB | — | |
| BTRX6 | CI2M:COCH | C/I Co channel Rejection | — | 12 | — | dB | — |
| CI2M:±2 MHz | C/I Adjacent Channel Rejection | — | 14 | — | dB | — | |
| CI2M:±4 MHz | C/I Adjacent Channel Rejection | — | 12 | — | dB | — | |
| CI2M:ADJ(6+2n) | C/I Alternate Channel Rejection | — | 14 | — | dB | — | |
| CI2M:IMG | C/I Image Frequency Rejection | — | 13 | — | dB | — | |
| CI2M:IMG±2 MHz | C/I Adjacent Channel to Image Freq Rejection | — | 14 | — | dB | — | |
| BTRX7 | BLOCK1M:<2 GHZ | Blocking performance from 30 MHz to 2 GHz | — | 20 | — | dB | — |
| BLOCK1M:2 GHZ<SIG<2399 MHz | Blocking performance from 2003–2399 MHz | — | 20 | — | dB | — | |
| BLOCK1M:2484 MHZ<SIG<2977 MHz | Blocking performance between 2484–2997 MHz | — | 20 | — | dB | — | |
| BLOCK1M:3 GHZ<SIG<12.75 GHz | Blocking Performance between 3.0–12.5 GHz | — | 20 | — | dB | — | |
| BTRX8 | BLE1M:INTERMOD | Inter modulation performance for BLEM | — | 8.5 | — | dB | — |
| BLE2M:INTERMOD | Inter modulation performance for BLEM | — | 9.5 | — | dB | — | |
|
Note:
| |||||||
| DC Characteristics | Standard Operating Conditions: VDD33 = VDDIO = AVDD
= 1.9–3.6V (Unless Otherwise Stated) Operating Temperature: -40°C ≤ TA ≤ +125°C for Extended Temperature | ||||||||
|---|---|---|---|---|---|---|---|---|---|
| Parameter Number | Symbol | Characteristics | RF Power | CPU Frequency | Min. | Typ. | Max. | Units | Conditions |
| IBLETX_1 | IDDTXPA1M | Current Consumption with TX in MLDO mode at 1 Mbps | +11 dBm | 128 MHz | — | 52.9 | — | mA | VDD = 3.3V; Temperature = 25°C CPU Consumption included |
| +11 dBm | 64 MHz | — | 46.0 | — | mA | ||||
| +11 dBm | 32 MHz | — | 42.5 | — | mA | ||||
| 0 dBm | 128 MHz | — | 28.3 | — | mA | ||||
| 0 dBm | 64 MHz | — | 21.4 | — | mA | ||||
| 0 dBm | 32 MHz | — | 18.0 | — | mA | ||||
| IBLETX_3 | IDDTXPA1B | Current Consumption with TX in Buck mode at 1 Mbps | +11 dBm | 128 MHz | — | 26.3 | — | mA | |
| +11 dBm | 64 MHz | — | 22.9 | — | mA | ||||
| +11 dBm | 32 MHz | — | 21.3 | — | mA | ||||
| 0 dBm | 128 MHz | — | 15.0 | — | mA | ||||
| 0 dBm | 64 MHz | — | 11.7 | — | mA | ||||
| 0 dBm | 32 MHz | — | 10.1 | — | mA | ||||
| IBLERX_1 | IDDRXBLE1M | Current consumption at Rx signal MLDO mode at 1 Mbps | -80 dBm | 128 MHz | — | 22.7 | — | mA | |
| -80 dBm | 64 MHz | — | 15.8 | — | mA | ||||
| -80 dBm | 32 MHz | — | 12.3 | — | mA | ||||
| IBLERX_3 | IDDRXBLE1B | Current consumption at Rx signal BUCK mode at 1 Mbps | -80 dBm | 128 MHz | — | 12.5 | — | mA | |
| -80 dBm | 64 MHz | — | 9.2 | — | mA | ||||
| -80 dBm | 32 MHz | — | 7.6 | — | mA | ||||
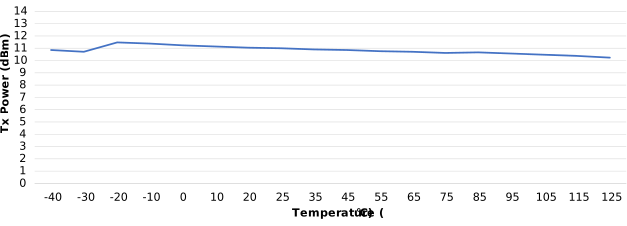
Note:
- Bluetooth Low Energy transmit power is measured across temperature after transmit power calibration at 3.6V and 2440 MHz.
- Temperature power compensation is triggered before power measurement.
- Transmit power is measured after the PA matching and LPF.
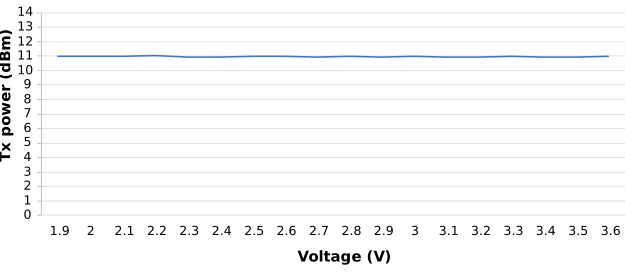
Note:
- Bluetooth Low Energy transmit power is measured across voltage after transmit power calibration.
- Transmit power is measured after calibration at +11 dBm (± 0.5 dBm).
- Transmit power is measured on board based on the Microchip Reference Design.
- Transmit power is measured after the PA matching and LPF.
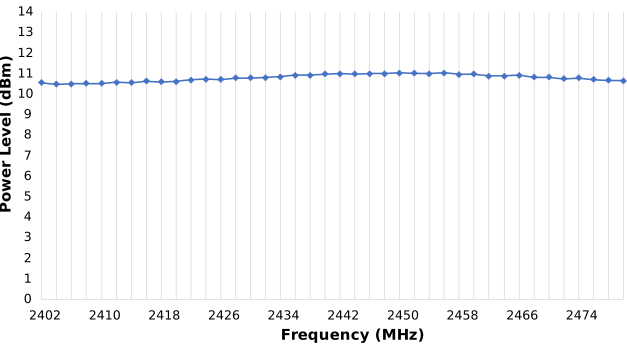
Note:
- Bluetooth Low Energy transmit power is measured across frequency after transmit power calibration at 3.3V (Buck mode).
- Transmit power is measured after the PA matching and LPF.
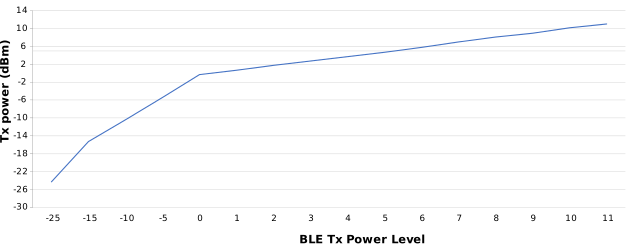
Note:
- Bluetooth Low Energy transmit power is measured at 2440 MHz after transmit power calibration.
- Transmit power is measured on board based on Microchip Technology Reference Design.
- Transmit power is measured after the PA match and LPF.
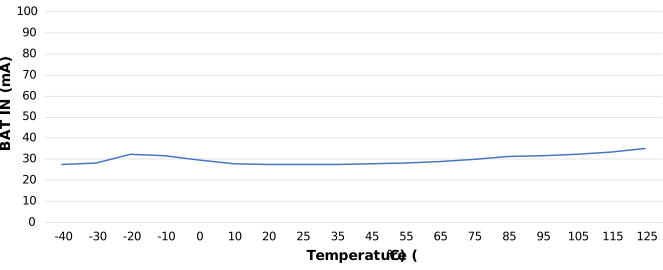
Note:
- Bluetooth Low Energy transmit current is measured at 3.3V (Buck mode) at 2440 MHz across temperature.
- Transmit current is measured after calibration at +11 dBm (± 0.5 dBm).
- Current is measured on input power rail to SoC.
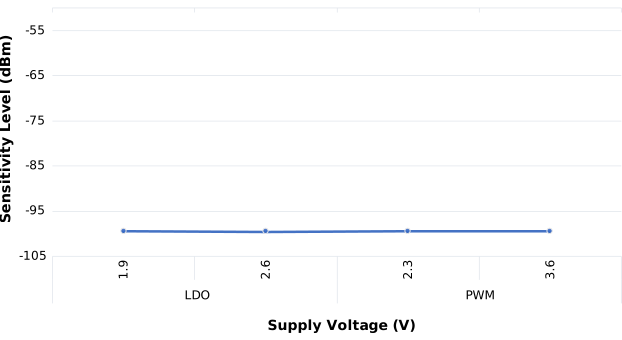
Note:
- Bluetooth Low Energy 1M C/I Margin is measured at 2440 MHz at 25℃, uncoded data at 1 Ms/s.
- PDU length = 37.
- Sensitivity is measured according to the SIG specifications.
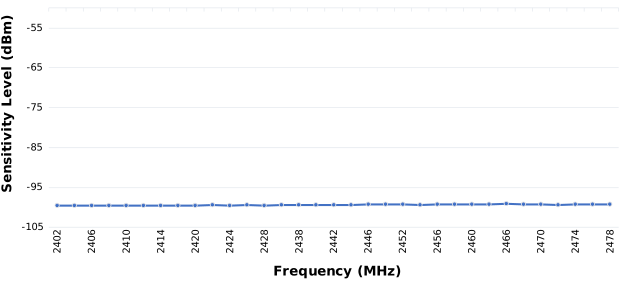
Note:
- Bluetooth Low Energy receiver sensitivity is measured across channels at 3.6V at 25℃, uncoded data at 1 Ms/s.
- PDU length = 37.
- Sensitivity is measured according to the SIG specifications.
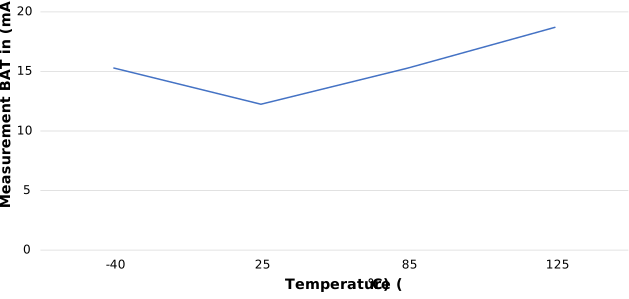
Note:
- Bluetooth Low Energy receive current is measured at 3.3V (Buck mode), uncoded data at 1 Ms/s with LNA configured at maximum gain.
- PDU length = 37.
- Current is measured on input power rail to SoC (includes processor current as well).
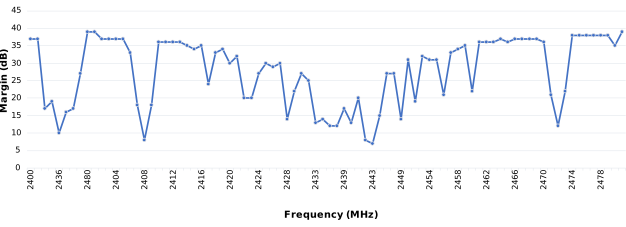
Note:
- Bluetooth Low Energy 1M C/I Margin is measured at 25℃, 3.6V, uncoded data at 1 Ms/s.
- Reported C/I margin is the margin above the C/I specifications from SIG.
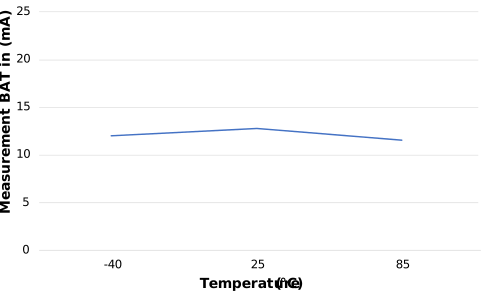
Note:
- Bluetooth Low Energy receive current is measured at 3.3V (Buck mode), uncoded data at 1 Ms/s with LNA configured at maximum gain.
- PDU length = 37.
- Current is measured on input power rail to SoC (includes processor current as well).
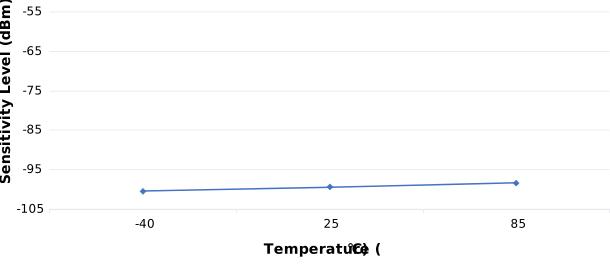
Note:
- Bluetooth Low Energy receive sensitivity is measured across temperature at 3.6V, 2440 MHz, uncoded data at 1 Ms/s.
- PDU length = 37.
- Sensitivity is measured according to the SIG specifications.
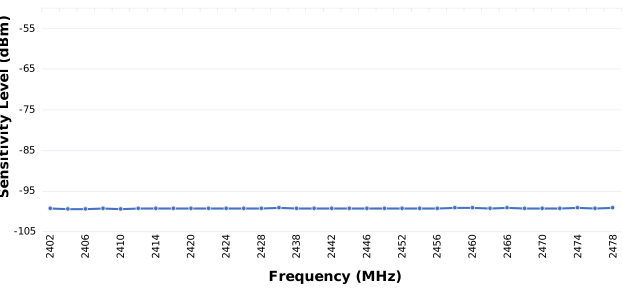
Note:
- Bluetooth Low Energy receive sensitivity is measured across temperature at 3.6V at 25℃, uncoded data at 1 Ms/s.
- PDU length = 37.
- Sensitivity is measured according to the SIG specifications.